
A failure rate is the number of times a device or system fails during a specific period of use. You calculate this value by dividing the total number of failures by the total time that the items were in operation. This metric helps engineers understand the reliability of a product over its expected lifespan.
Defining failure rate and how it’s calculated
Reliability professionals use this calculation to predict how long a component will last before it breaks down. It’s often expressed as failures per hour or as a percentage over a set duration. If your system is mission-critical, you monitor this rate closely to decide when to perform maintenance or replace parts.
The math relies on the total operating time of all units tested. If you have 100 light bulbs and run them for 1,000 hours each, your total test time is 100,000 hours. If 2 bulbs burn out during that test, your rate is 2 divided by 100,000. This equals 0.00002 failures per hour.
Most beginners make the mistake of ignoring the “infant mortality” phase. This is the period where defects in manufacturing cause early failures. If you include these in your steady-state reliability math, you’ll overestimate your risk. Only calculate your failure rate after you have burned in the units to weed out these initial flaws.
You must also distinguish between repairable and non-repairable systems. For a non-repairable part, like a fuse, focus on the mean time to failure. For a repairable system, like a server, track the mean time between failures. If you treat a repairable system as a single-use component, you’ll prematurely discard hardware that still has significant life remaining.
Ensure your data collection covers the entire population of units to keep the calculation accurate. Any missing logs from a single batch will skew your results and lead to expensive, unnecessary replacements.
When the math changes
The standard calculation assumes a constant rate of failure, which is rarely true for new or very old products. You must adjust your approach based on the lifecycle stage of the hardware you’re testing.
| Situation | What changes | What to do instead |
|---|---|---|
| Early life | High initial defects | Use infant mortality tracking |
| Wear-out phase | Parts degrade quickly | Track mean time to failure |
| Repairable items | Units return to service | Use mean time between failures |
| Complex systems | Multiple sub-components | Sum individual component rates |
| Harsh environments | External stress factors | Apply environmental correction factors |
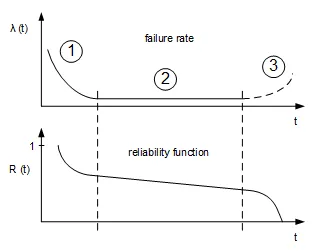
If your failure rate curve looks like a bathtub, you’re likely misapplying constant-rate math to the initial burn-in period. During the first 500 hours of operation, failures are usually caused by manufacturing defects rather than random chance.
Distinguish between these phases by checking your cumulative failure distribution. If the failure rate is decreasing over time, you’re in the infant mortality phase. If it’s increasing, you have entered the wear-out phase. Only when the rate remains flat are you in the useful life period where standard math applies.
Many engineers make the mistake of using the same reliability target for both new prototypes and legacy hardware. This leads to over-engineering early designs while ignoring critical safety thresholds in aging systems.
Steps to measure reliability
Select a group of at least 30 identical units to test under controlled conditions. Small sample sizes often hide intermittent faults that only emerge after prolonged stress.
Record the exact total operating hours for every unit in the group. Don’t estimate; use automated logging software to track every second of uptime.
Count the number of confirmed failures that occur during the test period. Distinguish between a design defect and user error. If the failure resulted from misuse, exclude it to avoid skewing your reliability data.
Divide the number of failures by the total operating time of all units. This yields your failure rate per hour.
Multiply the result by the time unit, such as 1,000 or 1,000,000 hours. This standardizes your data for easier benchmarking across different product lines.
Compare this final number against your quality targets to identify performance gaps. If your rate exceeds your target, check if the failures clustered at the start of the test. Early-life failures suggest a manufacturing defect, whereas failures late in the test indicate wear-out. If you see a constant failure rate, the issue is likely random environmental stress rather than a fundamental design flaw.
Common mistakes in reliability tracking
Failing to record the exact hours for each unit makes your failure rate meaningless. If you can’t pinpoint the precise run-time of a component, you’re guessing at its reliability rather than measuring it. Track the total operational time for every individual serial number, not just the aggregate time for the fleet.
Combining data from old and new models hides design improvements and masks lingering defects. If you have updated a firmware version or swapped a component, segment your data by revision. Comparing a legacy unit to a current one creates a “blended” metric that tells you nothing about the health of your latest build.
Including routine maintenance or user error as a mechanical failure ruins the accuracy of your data. A failure requires a loss of function, not a scheduled filter change or an operator mistake. If you count every service call as a failure, you’ll never identify the true mean time between failures for your hardware.
Testing in a controlled lab while ignoring real-world deployment leads to false expectations. If your product faces extreme heat or vibration in the field, a climate-controlled test is a vanity metric. If the environment changes, your failure rate will shift by an order of magnitude.
Frequently asked questions
Can I calculate this without a large sample size?
You can calculate a rate with a small sample, but the result will be less accurate. A smaller group of units provides a wider margin of error, making it harder to predict long-term performance. If you have fewer than 10 units, focus on observing the specific causes of failure rather than calculating a general statistical rate.
Why do some companies use mean time between failures?
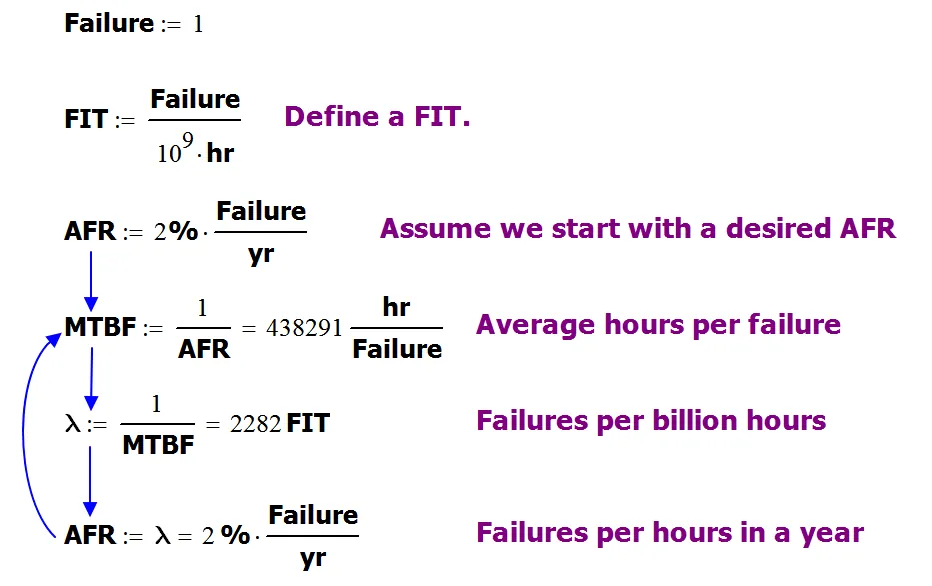
Companies use this term because it’s easier to understand than a raw decimal rate for repairable systems. It represents the average time a device operates before it needs a repair. If you have a rate of 0.01 failures per hour, your mean time between failures is 100 hours of operation.
Is it safe to assume the rate stays constant?
It’s rarely safe to assume a constant rate throughout the entire life of a product. Most devices experience a high failure rate when they’re new, followed by a long period of stability, and finally a spike in failures as parts wear out. This pattern is often called the bathtub curve in reliability engineering.
What happens if my calculation results in zero?
A result of zero means that no failures occurred during your specific test period. This doesn’t mean the product will never fail, only that it remained stable during that window. You should continue the test for more hours to see if the rate changes as the units age.
Does the operating environment change the result?
The environment changes the result significantly because heat, vibration, and humidity accelerate physical wear. A device rated for 10,000 hours in a climate-controlled office might fail in 500 hours in a hot factory. Always define the temperature and stress levels when you report your reliability numbers to your team.
How do I know if my result is good?
You know your result is good by comparing it to the manufacturer’s specifications or industry benchmarks for similar hardware. If your calculated rate is higher than the official data, your units are likely failing prematurely. Check your maintenance logs or operating conditions to see if external factors are causing the difference.
Conclusion
Monitoring these trends over time provides a clearer picture of your equipment’s health. Once you’ve gathered enough data, you’ll be ready to spot patterns that lead to unexpected breakdowns. It’s a great way to improve your maintenance schedule, so don’t hesitate to start tracking your results more closely today.
