
The ratio of electrons produced to photons hitting a sensor is what quantum efficiency describes, and it’s measured by comparing the electrical current output to the light intensity input. If your sensor has a high value, it captures more light; if it’s low, you lose signal. This value changes based on the wavelength of light, so you must check your device’s specific spectral response curve.
Defining quantum efficiency and how it’s measured
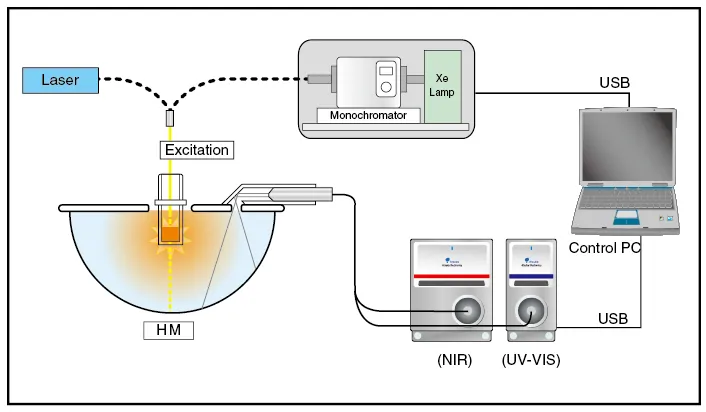
This ratio helps engineers determine how well a light-sensitive device, like a digital camera sensor or a solar cell, turns light into electricity. Because it’s a percentage, a value of 1.0 means every incoming photon creates one electron. Most common silicon sensors range between 0.3 and 0.9 depending on the light color.
If your device shows a value above 1.0, you have a measurement error. This usually happens when the sensor’s active area is smaller than the beam diameter, causing you to overestimate the incident light. Always mask your sensor to match the aperture size precisely.
Measure the incident light intensity using a calibrated photodiode to ensure accuracy. Count the number of electrical charges generated by the sensor under the same light. Divide the number of electrons by the number of incident photons to find the percentage.
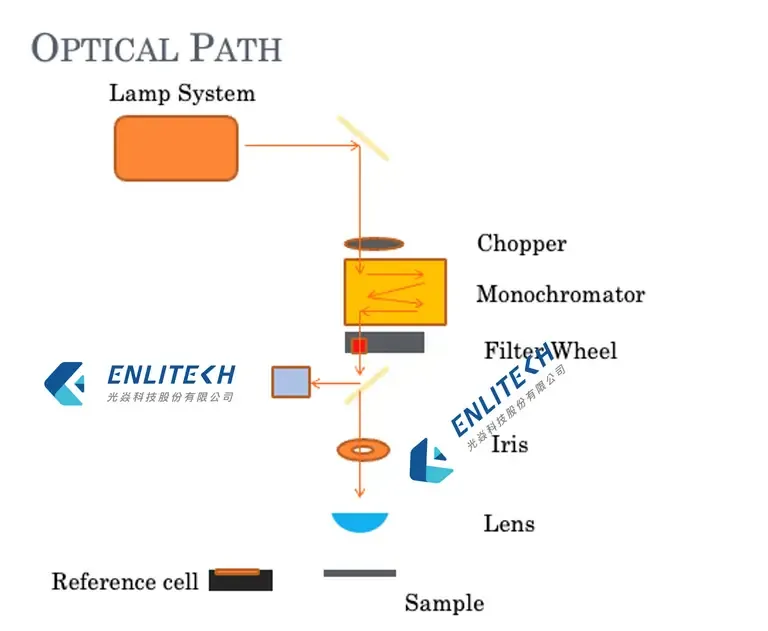
Test at different wavelengths because sensors react differently to blue, green, and red light. Use a monochromator to isolate specific light colors during your testing process. If you’re testing for outdoor solar applications, prioritize measurements at 550 nanometers. This wavelength represents the peak sensitivity of the human eye and serves as a vital baseline for most commercial silicon-based technologies.
Why this ratio matters for your equipment
The physical mechanism behind this process relies on the photoelectric effect. When a photon with enough energy hits a semiconductor material, it knocks an electron loose from its atom. This creates an electron-hole pair that can be collected as an electrical current. If the photon energy is too low, it passes through the material without creating a charge, which lowers your efficiency.
Designers optimize these sensors by changing the thickness of the material or adding anti-reflective coatings. If the material is too thin, photons pass through without hitting an atom; if it’s too thick, the electrons might get trapped before reaching the wires. The specific geometry depends on the intended use, such as high-speed imaging or low-light astronomy.
You can find the specific performance data for your device by looking at its spectral response chart. This chart shows the percentage of efficiency plotted against the wavelength in nanometers. If you’re comparing two sensors, always look at the efficiency at the specific wavelength you plan to use, not just the peak value. A sensor might look great at 500nm but perform poorly at 800nm.
Situations where efficiency values differ
The simple calculation assumes a perfect environment, but real-world conditions often change the final result. You must adjust your expectations based on the hardware and the light source you’re using.
| Situation | What changes | What to do instead |
|---|---|---|
| Infrared light | Material absorption | Use specialized InGaAs sensors |
| Low light levels | Noise floor | Use cooled CCD sensors |
| Broad spectrum | Wavelength variance | Integrate over the full range |
| High intensity | Saturation point | Use neutral density filters |
| Angled light | Surface reflection | Use anti-reflective coatings |
Relying on standard calculations here often leads to clipped data peaks that render your entire dataset unusable.
When measuring at an angle, check the incident light against the material’s refractive index. If the angle exceeds 30 degrees, the reflection loss increases significantly. In these cases, apply a Fresnel correction factor to your final output.
If you’re unsure which condition applies, perform a baseline test at 50% power. If the output signal remains linear, your current hardware is sufficient. If the signal flattens, you have hit a saturation limit and must introduce optical attenuation immediately.
Steps to measure your sensor performance
-
Set up a stable, calibrated light source that outputs a known amount of power. Use a tungsten-halogen lamp for broad-spectrum testing, but ensure it warms up for at least thirty minutes to prevent thermal drift from skewing your baseline.
-
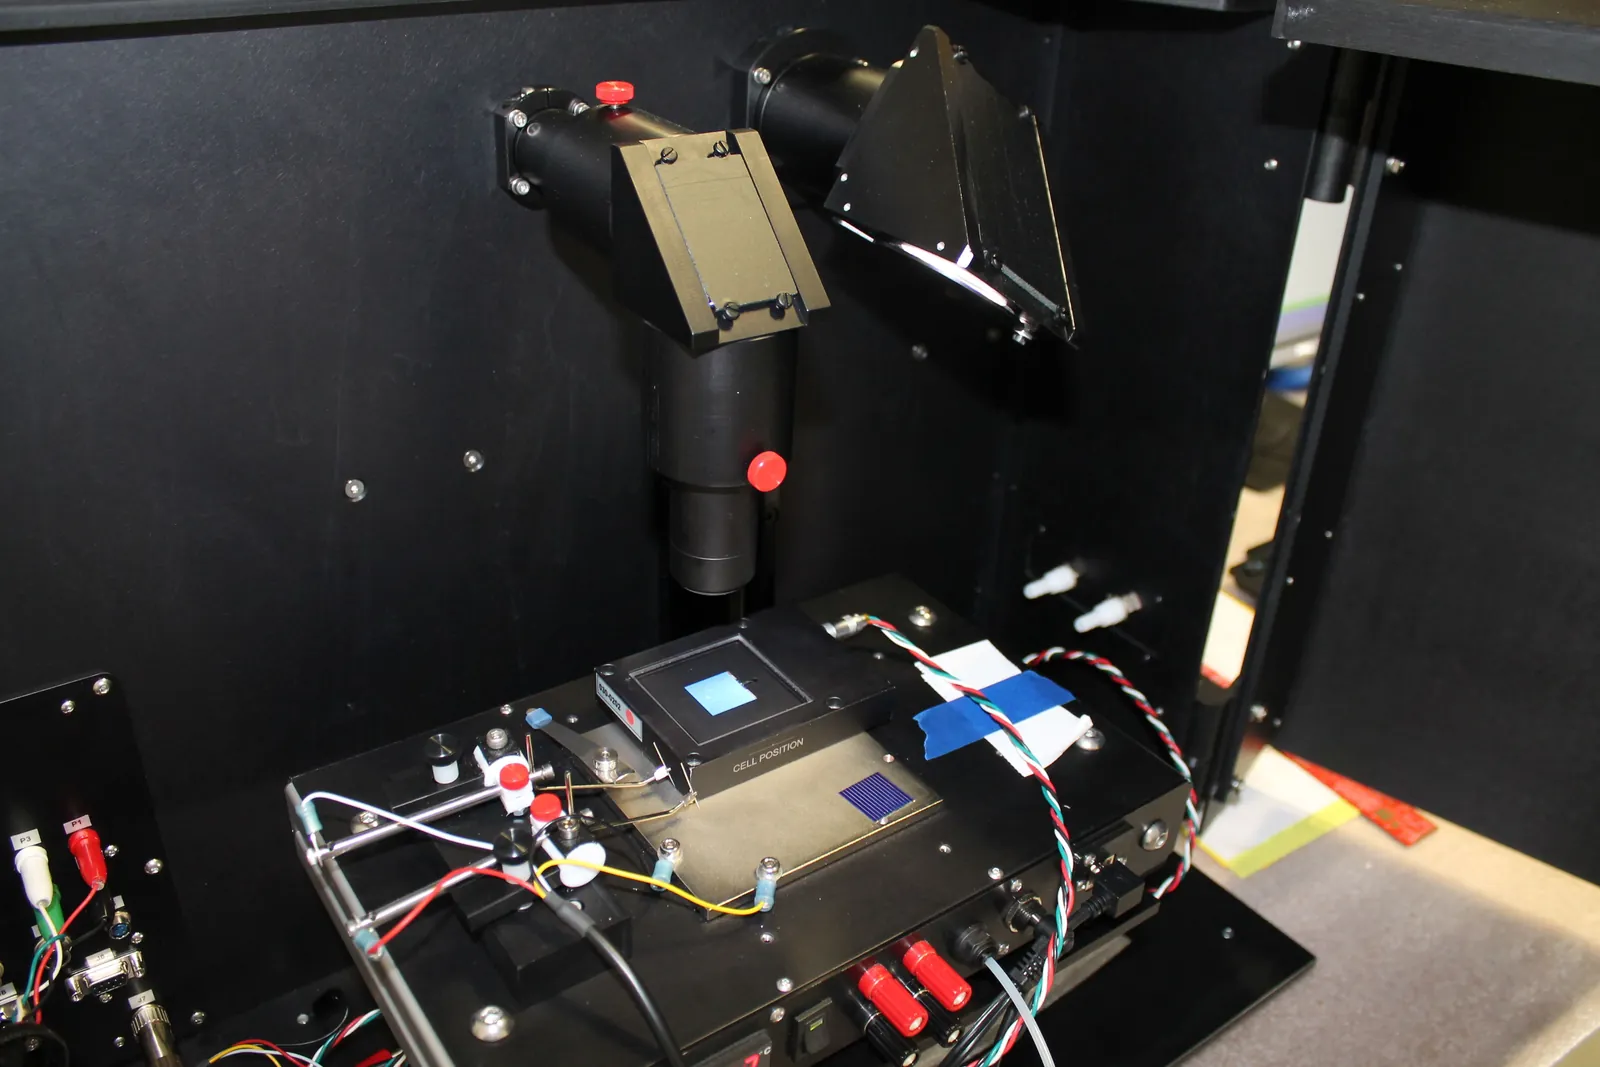
Place a reference photodiode in the beam to measure the exact photon flux. Position this sensor at the precise focal point where your test unit will reside to eliminate spatial variance.
-
Replace the reference diode with your test sensor in the exact same position. If the sensor housing is off by even two millimeters, you’ll introduce a geometric error that invalidates your quantum efficiency calculation.
-
Measure the output current using a high-precision ammeter while keeping the temperature constant. Use a thermoelectric cooler to hold the sensor at 25 degrees Celsius; failing to do so allows dark current to inflate your readings, often by as much as ten percent in high-gain modes.
-
Calculate the electrons per second by dividing current by the elementary charge constant. If your calculated value deviates from the manufacturer’s provided spectral sensitivity data by more than five percent, recalibrate your light source.
-
Check for signal saturation by incrementally increasing the flux. If the output current stops tracking linearly with the input power, you have exceeded the sensor’s full-well capacity and must use a neutral density filter to attenuate the beam.
Mistakes that ruin your sensor data
Ignoring the ambient temperature of your sensor increases dark current, which creates a noise floor that hides your true signal. If your operating environment fluctuates by more than five degrees Celsius, you must implement active thermal compensation or your data will drift significantly over time.
Relying on an uncalibrated light source makes your results impossible to replicate or compare against industry standards. Always verify your source’s spectral output against a NIST-traceable reference before starting a test.
Surface reflections often cause you to overestimate the light reaching the silicon. Apply an anti-reflective coating or use an integrating sphere to ensure you measure incident light rather than stray glare.
Testing outside the sensor’s specified design range leads to non-linear readings and permanent hardware degradation. If your intensity levels exceed the saturation point, you must use neutral density filters to bring the signal back into the linear operating region.
Frequently asked questions
Can I measure this with a standard multimeter?
You can’t measure it with a standard multimeter alone because you need to know the exact photon count. You must use a calibrated reference detector to find the light intensity first, then calculate the conversion ratio based on the current output of your specific sensor.
Why does the value change for different colors?
The value changes because semiconductor materials have a bandgap that limits which photon energies they can absorb. Blue light carries more energy than red light, so the material interacts with these wavelengths at different depths and rates, shifting the efficiency curve across the spectrum.
How long does a sensor maintain its efficiency?
A sensor maintains its efficiency for many years if it’s kept within its rated temperature and humidity limits. Over time, high-energy radiation or extreme heat can damage the semiconductor lattice, which slowly lowers the ability of the device to convert light into electrical signals.
Is it safe to test this in direct sunlight?
It isn’t safe to test in direct sunlight because the intensity will likely saturate or burn out sensitive measuring equipment. Always use a controlled, dimmed light source that matches the intensity levels you expect to encounter during your actual application of the sensor.
Does the sensor size affect the efficiency?
It doesn’t affect the efficiency percentage, but it changes the total number of electrons collected. A larger sensor area captures more photons in total, but the ratio of electrons to photons remains a property of the material and the manufacturing process used for that specific sensor.
What happens if I use the wrong wavelength?
If you use the wrong wavelength, your measured efficiency will be lower than the peak rating of the sensor. The device will likely produce a very weak signal or no signal at all if the light energy is below the material’s threshold for creating an electron-hole pair.
Conclusion
Choosing the right sensor doesn’t have to be a guessing game. Before you start your next project, take a look at the manufacturer’s data sheet to see how the device handles your specific light source. It’s a simple step that’ll help you get the clear, reliable results you’re looking for.
