
A flowchart is a visual diagram that maps out the steps of a process, using specific shapes to represent different actions or decisions. You can think of it as a roadmap for any task, where each shape acts as a signpost to show you exactly which direction to go next. It helps people see the flow of work from start to finish without needing long, confusing paragraphs of text.
The main thing that decides if your diagram is useful is whether you keep the sequence logical and clear. If you add too many loops or crossing lines, the reader will get lost, and the map loses its purpose. The most common mistake is trying to fit an entire complex project into one single page, which makes the text too small to read and the logic impossible to follow.
How to create a flowchart using symbols
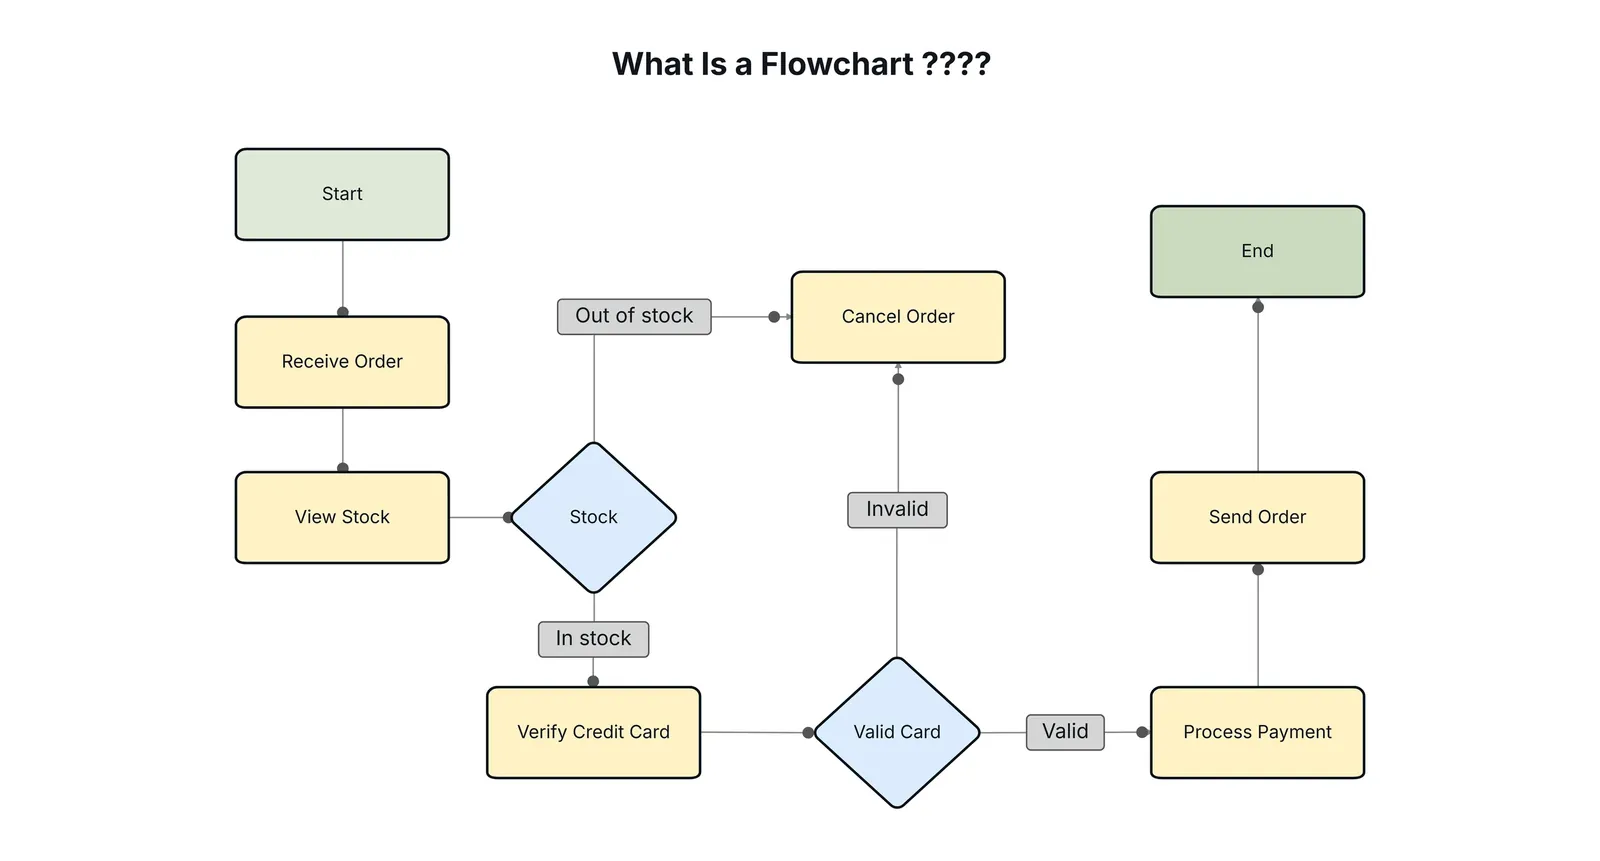
Identify the starting point of your process and draw an oval shape, which represents the beginning or end of your workflow. Every map requires one clear trigger event, such as “Customer places order,” to prevent ambiguity about when the clock starts.
Write the first action inside a rectangle, the standard symbol for any task. Use active verbs like “verify” or “calculate” rather than passive descriptions to keep the workflow actionable.
Add a diamond shape when you reach a point where a choice must be made. If your diamond lacks at least two distinct exit paths, you have failed to account for a branch in the logic. One path must represent the “happy path” of success, while the other addresses the failure or exception state.
Draw arrows to connect these shapes, showing the direction the process moves. Never allow an arrow to cross another; if your lines tangle, your process is likely too complex and requires simplification.
Keep your diagram to a single page. If your process exceeds 10 steps, use a connector circle to link to a second page. Trying to cram a massive workflow into one sheet forces you to shrink the text, rendering the map unreadable on a standard monitor.
Follow the ISO 5807 standard for information processing to ensure your symbols remain compatible with global industry practices. Use consistent colors for each shape type to help your audience recognize the structure faster. If you find yourself using more than three colors, you’re likely over-complicating the visual hierarchy.
How much time to plan and draw
The time it takes to build a diagram depends on how many moving parts your process has and whether you have already mapped out the logic on paper. For a simple task, you can finish in under 30 minutes, but complex business workflows might take several days of review.
| Situation | How long | What changes it | What to watch for |
|---|---|---|---|
| Simple task | 15–30 mins | Fewer than 5 steps | Keeping it too simple |
| Office workflow | 2–4 hours | Number of departments | Missing decision paths |
| Project plan | 1–2 days | Data research needs | Overcomplicating the logic |
If your project is taking much longer than expected, stop adding detail and focus only on the main path. Most people get stuck trying to include every tiny exception to the rule, which usually just creates more confusion.
If you find yourself spending more than four hours on a single workflow, you have likely moved from mapping to designing. A map tracks reality, but a design attempts to fix it. If the process you’re documenting is broken, document the mess first. Only after the current state is clear should you attempt to draw the ideal future state.
Use this rule: if you can explain the process to a colleague in under two minutes, your diagram should take no longer than an hour. If you can’t summarize the steps verbally, you aren’t ready to draw. Spend that time interviewing stakeholders instead.
Signs your diagram is finished
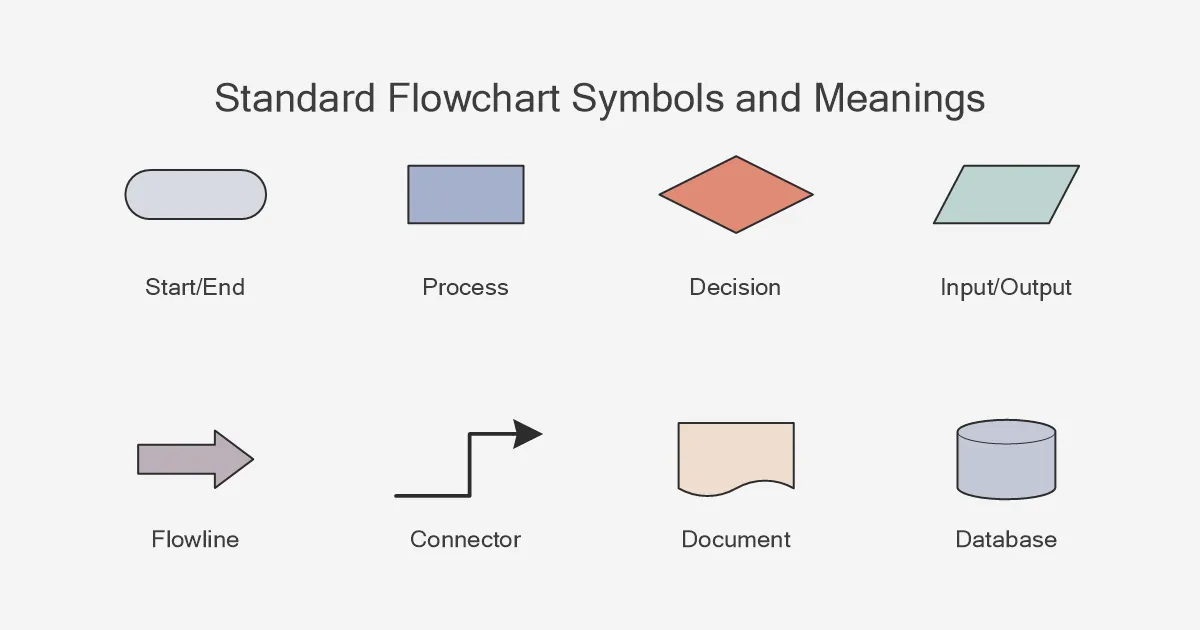
A complete diagram is easy to read because it has a clear start and a clear end. You should be able to follow the arrows from the top oval to the bottom oval without getting stuck in a loop that has no exit. If you show your chart to a coworker and they can explain the process back to you without asking questions, your work is done.
Check that every diamond has a clear label on the lines coming out of it, such as “yes” or “no.” If a line just hangs in the air, the process is incomplete. A finished chart should feel like a story that moves forward at every turn. When in doubt, look for “dead ends” where a symbol has no exit arrow, as these are the most common spots where processes break down.
If your diagram contains more than twelve distinct steps, break it into two separate pages. A single page that requires a magnifying glass to read is a failure of communication. If a user has to squint to follow your logic, they will stop looking at your work entirely.
Apply the rule of three: if you find yourself drawing more than three nested loops, simplify the logic. Complex loops usually signal that you’re documenting an edge case rather than the standard workflow. Move those rare exceptions to a footnote or a secondary appendix. If the main path remains clear to a novice, your diagram is ready for use.
Mistakes that break the flow
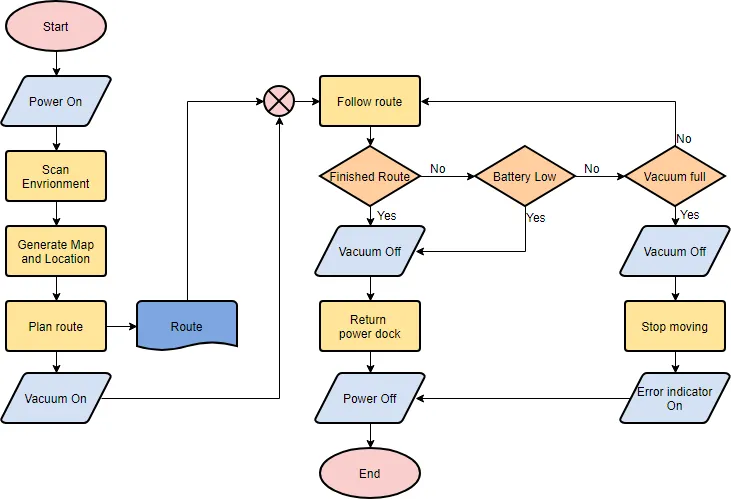
Using too many shapes makes a chart look chaotic and difficult to scan. Stick to the standard set of ovals for starts, rectangles for tasks, and diamonds for decisions to keep the visual language clean. If you find yourself reaching for a unique icon for every minor action, you have crossed the line into decoration rather than utility.
When lines constantly cross over each other, the path becomes impossible to track. If your lines are tangling, move your shapes to create a straighter, cleaner path for the eye. A good rule is to keep the flow moving in one direction, typically top-to-bottom or left-to-right. If you must backtrack, use a distinct color for that return loop to prevent visual confusion.
Vague labels like “do something” provide no value. Use clear, active verbs like “send email” or “check inventory” so the reader knows exactly what action occurs. A common mistake is using nouns instead of verbs, which leaves the reader guessing about the requirement. If the label exceeds four words, you’re likely describing a process rather than a single step. Break it into two distinct shapes.
Related guides
Frequently asked questions
Can I use different colors for my flowchart?
Yes, you can use colors to group related steps, but don’t rely on color alone to explain your logic. If someone prints your chart in black and white, the flow must still be clear through the shapes and arrows. Use color only to highlight important stages or to distinguish between different departments involved in the task.
How long should a flowchart be?
A good flowchart should fit on one sheet of paper, which usually means about 10 to 15 steps. If your process is longer than that, break it into smaller, related sub-processes. This makes the information easier to digest and allows you to update one section later without having to redraw the entire map.
Is it safe to use online tools for confidential data?
No, you should never put sensitive company data into free, public online diagramming tools. If your process involves private customer information or trade secrets, use offline software or a secure, private account approved by your IT department. Always check your company’s data security policy before uploading any internal workflows to a cloud-based service.
What happens if I have a process with no end?
If your process has no end, it’s likely a continuous cycle rather than a linear task. You should represent this by drawing the last step with an arrow that loops back to the beginning of the cycle. Be sure to label this loop clearly so the reader understands that this part of the process repeats indefinitely.
How many symbols do I really need to know?
You only need to know three core symbols to build most diagrams. Use an oval for the start and end, a rectangle for any action, and a diamond for any decision. While there are dozens of specialized shapes for engineering or software, using only these three keeps your chart accessible to everyone in your office.
Conclusion
Using these diagrams makes complex projects feel much simpler to manage. You’ll find that sketching out your own process helps you spot hidden problems before they start. Why not grab a piece of paper and draw your first one today? It’s a great way to get your team on the same page.
