
Charge transfer resistance is the opposition to the flow of electrons between an electrode and an electrolyte during an electrochemical reaction. It’s a vital measure of how easily a battery or fuel cell can move energy at the interface. You can calculate this value by measuring the current response to a small voltage change, which is typically done using electrochemical impedance spectroscopy.
This resistance is the most important factor in determining the internal power losses of a battery during operation. It fluctuates based on the surface area of the electrode, the temperature of the system, and the chemical composition of the electrolyte. If the surface is clean, the resistance remains low; if it’s coated in impurities or degradation products, the resistance increases, which slows down the device.
The most common mistake people make is ignoring the impact of temperature on these measurements. They often record data at room temperature and assume it applies to all conditions. However, electrochemical kinetics are highly sensitive to heat, and a small change in environment can significantly alter the resistance value. Always record the exact temperature of your cell during testing to ensure your data is actually useful.
Controlling charge transfer resistance measurements
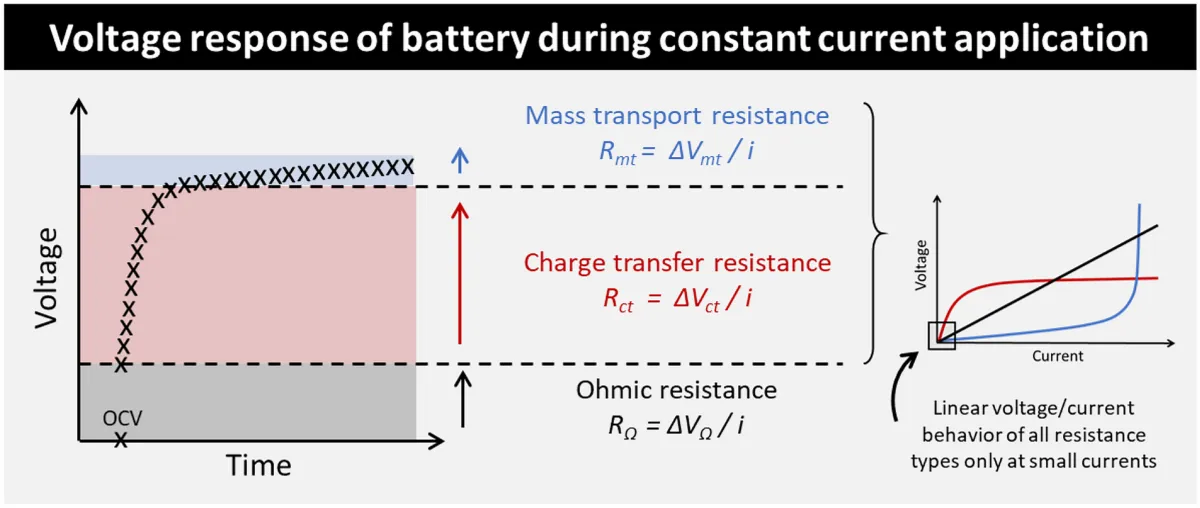
To accurately find the value for your specific system, you must use a potentiostat to perform electrochemical impedance spectroscopy. This process provides a clear view of how your electrodes perform under load.
Connect your three-electrode cell to a potentiostat, ensuring the working, reference, and counter electrodes are positioned correctly. Apply a small alternating voltage (AC) signal, usually between 5mV and 10mV, to the cell to avoid damaging the chemical equilibrium. If your signal is too large, the system enters a non-linear regime where the electrochemical response no longer corresponds to the circuit model, rendering your resistance calculation invalid.
Sweep the frequency range from 100 kHz down to 10 mHz to capture both high-frequency and low-frequency data points. Use a logarithmic sweep rather than a linear one to ensure you collect sufficient data at the low-frequency end where diffusion processes dominate.
Fit the resulting data to an equivalent circuit model, such as the Randles circuit, which includes a resistor to represent the charge transfer process. Extract the diameter of the semicircle on your Nyquist plot; this value represents the charge transfer resistance. If your plot shows a tail at low frequencies, you’re observing Warburg impedance, which indicates mass-transfer limitations rather than simple charge transfer.
Clean your electrodes thoroughly with deionized water before testing to remove surface contaminants that artificially inflate your resistance reading. A common mistake is failing to allow the open-circuit potential to stabilize for at least 30 minutes before starting the sweep. If the potential drifts during the measurement, the resulting Nyquist plot will appear distorted or disjointed.
If you lack the equipment or the training to interpret complex impedance data, contact a laboratory specializing in electrochemical analysis. Attempting to force-fit data into a model you don’t understand will lead to errors in your energy density estimates.
Time requirements for accurate testing
The time needed to measure this resistance depends on the stability of your electrochemical cell. If the system isn’t stable, the results will drift. That makes it impossible to get a reliable reading.
| Situation | How long | What changes it | What to watch for |
|---|---|---|---|
| Fresh battery cell | 15–30 minutes | Electrode surface area | Initial chemical settling |
| Degraded battery | 1–2 hours | Internal film buildup | Signal noise at low Hz |
| High-temp test | 30–45 minutes | Thermal expansion | Thermal equilibrium state |
Watch the phase angle at your lowest measurement frequency during that waiting period. A shift of more than two degrees per minute means the interface is still changing. Don’t record data while that happens.
People often mistake a quiet signal for a settled one. Noise can drop simply because a passivation layer thickens over the working electrode. The baseline looks flat, but the true resistance is climbing underneath it.
If the test takes much longer than these ranges, your cell is likely still reacting to the environment. The electrodes might not be fully wetted yet. Stop the test and allow the cell to rest for an additional hour before starting the measurement again.
Identifying the completion of the reaction
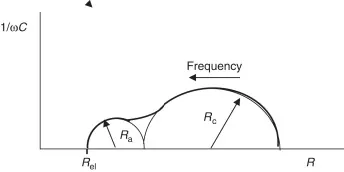
You can identify the state of the reaction by looking at the Nyquist plot generated by your software. A finished measurement shows a clear, closed semicircle at the high-frequency end of the graph, followed by a linear tail that represents ion diffusion. If the semicircle doesn’t close or looks jagged, the measurement is incomplete or affected by external electronic noise.
The gold standard for confirming your data is the Kramers-Kronig transform, which checks if your system was stable during the entire sweep. If the raw data doesn’t pass this mathematical check, the resistance value you calculated isn’t valid.
Always verify your results against a known standard resistor or a dummy cell before trusting your readings on a new, unknown battery chemistry. If you observe a residual drift in the baseline after the sweep, the cell has likely not reached thermal equilibrium.
Wait at least thirty minutes for the temperature to stabilize before restarting the test. If the plot shows a negative impedance loop, check your cable connections for inductive coupling. Tighten all leads to eliminate the interference before running the scan again.
Errors that compromise your results
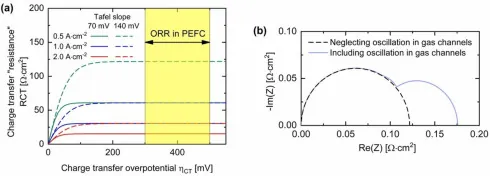
- Poor electrical contact: Loose cables or oxidized connectors add external resistance that the software can’t distinguish from the internal charge transfer resistance. Always ensure all leads are securely clamped and the connection points are polished to expose fresh metal.
- Inadequate cell equilibration: Starting the test before the electrolyte has fully penetrated the electrode pores causes the resistance to appear much higher than it actually is. Let the cell sit at open-circuit voltage for at least 30 minutes before you begin the frequency sweep.
- Incorrect frequency range: If you stop the sweep too soon, you’ll miss the semicircle entirely and fail to capture the charge transfer portion of the graph. Always extend your frequency range to at least 10 mHz to ensure the full kinetic process is visible.
Frequently Asked Questions
Can I measure this with a simple multimeter?
No, you can’t measure charge transfer resistance with a standard multimeter. A multimeter only measures direct current (DC) resistance, which doesn’t account for the capacitive and kinetic factors that define charge transfer. You need specialized equipment like a potentiostat to apply an AC signal and separate the different types of impedance occurring within the electrochemical cell.
Why does my resistance increase over time?
Your resistance increases because of chemical degradation or the buildup of a solid electrolyte interphase layer on the electrode surface. This layer acts as a barrier, making it physically harder for ions to move between the electrode and the electrolyte. If you notice a sudden jump in resistance, it’s often a sign that the battery is nearing the end of its functional life.
Is it safe to test a swollen battery?
No, you should never test a swollen or physically damaged battery for internal resistance. Swelling indicates that internal gases have built up, and the cell is at risk of venting or catching fire if you apply an electrical current. If you see physical deformation, treat the battery as a hazard and dispose of it at a local recycling facility according to your regional regulations.
How does temperature affect the resistance value?
Higher temperatures generally lower the charge transfer resistance because they increase the kinetic energy of the ions, making them move faster. For most standard lithium-ion chemistries, the resistance drops significantly as you move from 0°C to 25°C. If you’re comparing two different batteries, you must perform the tests at the exact same temperature, or your comparison will be meaningless.
What happens if the resistance is too high?
A high charge transfer resistance causes the battery to heat up during use and limits the amount of power it can deliver at once. You’ll notice this as a “voltage sag” when you try to draw high current, effectively reducing the performance of your device. If the resistance is high enough, the battery may fail to power the device at all, even if it holds a full charge.
Conclusion
Understanding these dynamics helps you design more efficient energy storage systems. If you’re working on a new prototype, try running a few tests under different temperatures to see how the values shift. It’s a great way to improve your device’s performance, and you’ll find that even small adjustments make a big difference.
